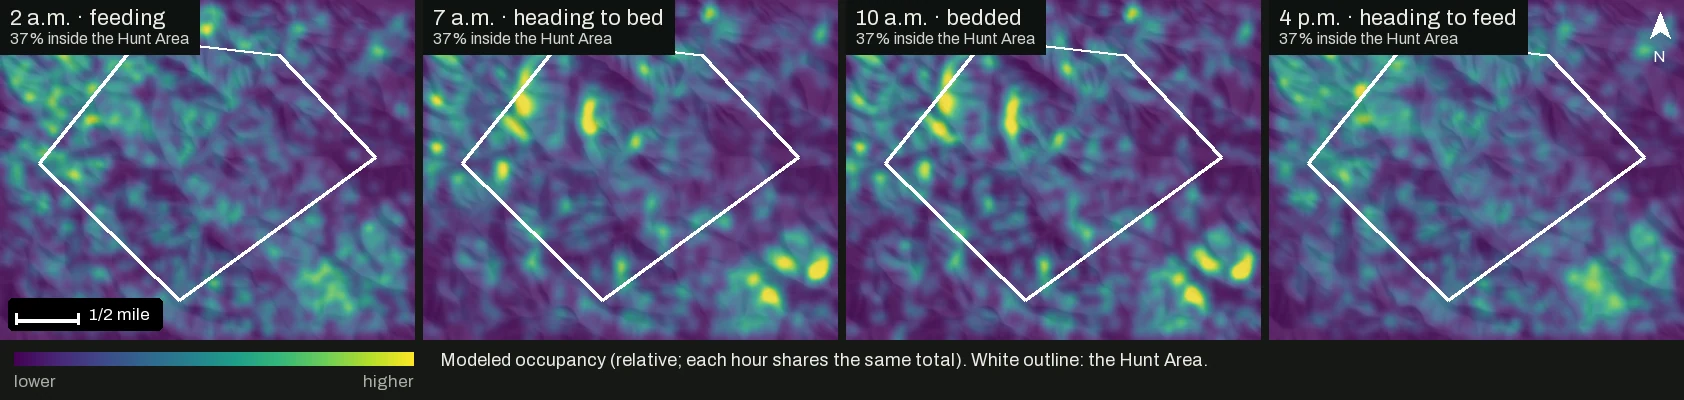
You found the beds last February and you know which oaks drop first. A map still can’t tell you where the deer are likely to be at 2 a.m., at first light or an hour before dark. And plenty of the deer that pass your stand bedded or fed across the line.
The short version
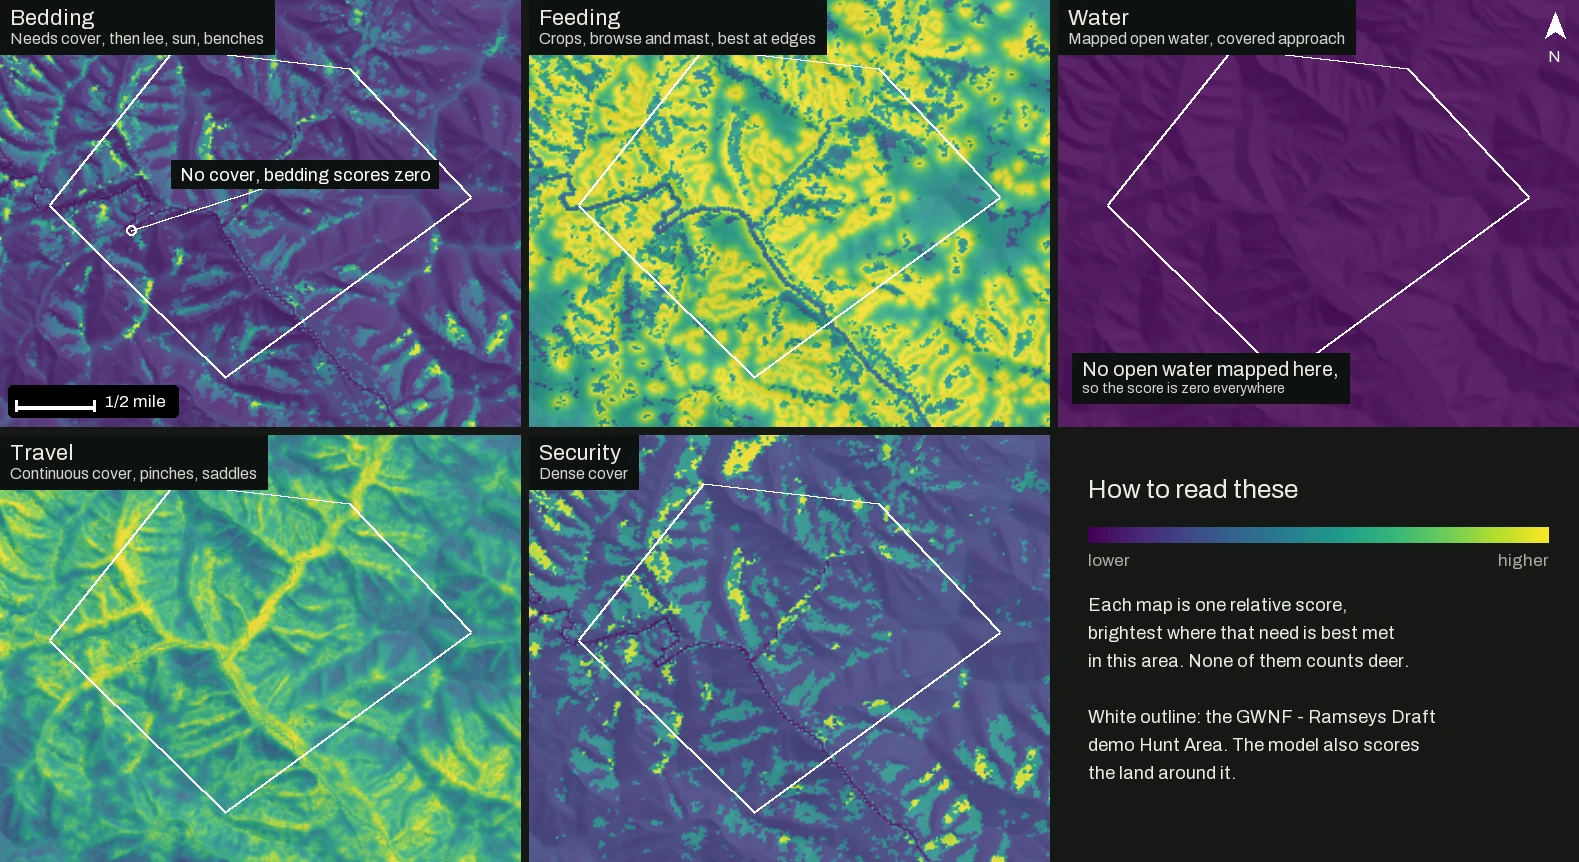
- 01Reckonar scores your ground for bedding, food, water, travel and security from USGS 3DEP lidar and national land cover maps. The scores are relative and do not count deer.
- 02It runs a whitetail day on that ground, timed to your sunrise and sunset, and maps modeled occupancy for every hour, across your boundary and the country around it.
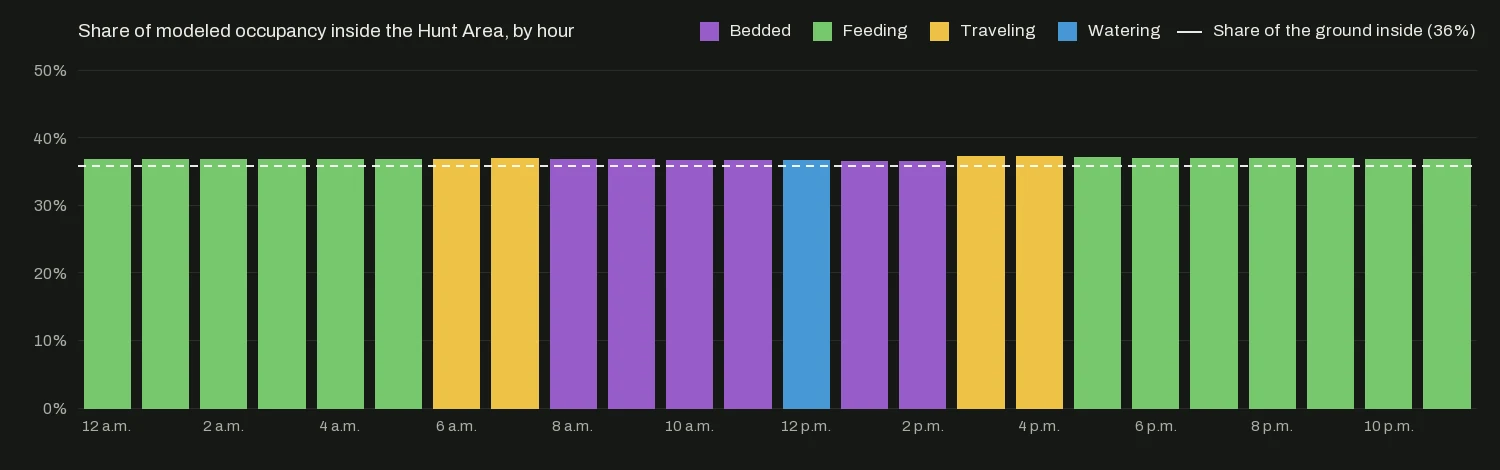
- 03On public land at Ramseys Draft in the George Washington National Forest, the Hunt Area’s share of the modeled deer matches its share of the habitat, about 36 percent, every hour of the day.
Five scores for the ground
Elevation comes from USGS 3DEP, the national elevation model built largely from airborne lidar. Where the raw lidar covers your area, Reckonar also reads how tall and dense the vegetation is. Land cover comes from NLCD and LANDFIRE, two national vegetation maps whose forest types show where oak and hickory grow.
Bedding gets the strictest rule. A spot without cover scores zero however good the terrain looks. Within cover, the score climbs downwind of the usual winds, on slopes the sun warms, on benches and points, and partway up a slope. When the leaves drop, hardwood cover thins and so does its score.
A deer’s day, set by the sun
Reckonar then runs a large set of simulated deer over the ground. Each gets a bed and a feeding spot drawn from the scores, close enough to commute between, and follows the schedule below. Where they spend each hour becomes that hour’s modeled occupancy map, like the four at the top of this page. Each map shows where deer are more likely to be and says nothing about how many.
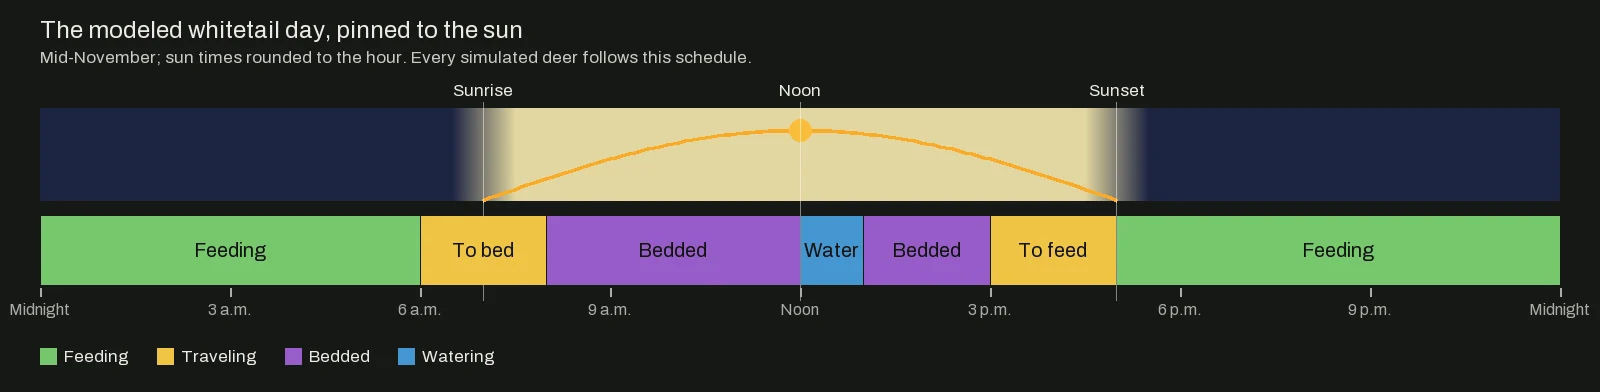
The season you pick for a Plan shifts the weighting between the scores, toward travel in the rut and toward food and cover late in the year.
Deer don’t read property lines
Deer cross a boundary all day, so the model runs on your Hunt Area plus a wide margin around it. A deer that beds on the neighbor’s bench and feeds in your clover shows up crossing your ground at dusk. Your share of the modeled deer should then follow the habitat you actually have. At Ramseys Draft the Hunt Area is 36 percent of the modeled ground and holds 36 percent of its bedding habitat, because the forest inside the boundary is much like the forest around it.
Corridors between bed and food
Corridors are the least-effort routes a deer could take between bedding and feeding areas, and Paying for the climb explains how they price a hill. In a Plan, the best bedding and feeding areas on your own ground always compete as corridor ends.
All of this is preparation. The model never sees a live deer, and Reckonar never tells you where one is right now.
What we don’t claim yet
- Relative scores. The model has no deer density; colors only rank places within your area.
- One routine. Every simulated deer keeps the same day in every season. The movement leaves out family groups, rut chasing and hunting pressure.
- Coarse inputs. Land cover comes in squares about 100 feet across, too coarse for a fencerow or this year’s acorns. Without qualified land cover the layer reads “Unknown habitat” and stays neutral. Water counts only where it is mapped.
- Your records count nearby. A bedding area, food plot or trail saved with Mark lifts the matching score around it in your Plans. Learning from trail-camera detections is designed and not built.
Where to find it in Reckonar
- Field → Layers has Relative habitat score and the five scores on web and phone, with Modeled occupancy and Corridors on the web.
- Plan a Hunt keeps modeled occupancy for the dates you choose, and the web Plan timeline plays it hour by hour as Deer presence.
- Mark records the beds, food plots and trails you have found, and Ask Reckonar can explain why a bench scores high for bedding.